COMPARING BOX PLOTS
Subscribe to our ▶️ YouTube channel 🔴 for the latest videos, updates, and tips.
Problem 1 :
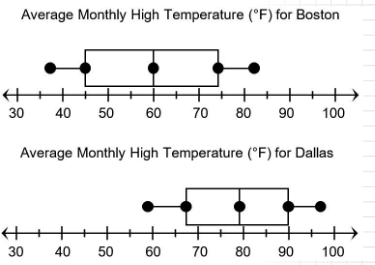
The comparative box plots below show the average high temperatures for Boston, Massachusetts, and Dallas, Texas. How do the interquartile range and median of the two data sets compare?
Solution:
Step 1:
Interquartile range:
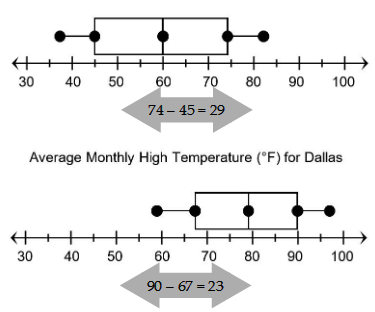
The interquartile range for Boston is about 29°F.
The interquartile range for Dallas is about 23°F.
Step 2 :
Compare the values for both interquartile ranges.
- 29 is greater than 23.
The interquartile range for Boston's median monthly high temperature is greater than the interquartile range for Dallas's median monthly high temperature.
Step 3 :
Estimate the median temperature for both data sets.
- The median in a box plot is represented by the vertical line inside the box.

The median monthly high temperature for Boston is 60°F.
The median monthly high temperature for Dallas is about 79°F.
Step 4 :
Compare the values for both medians.
- 60 is less than 79.
The median monthly high temperature for Boston is less than the median monthly high temperature for Dallas.
Problem 2 :
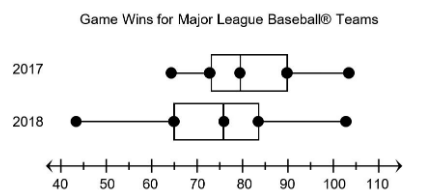
The comparative box plots show data about the number of wins scored by Major League Baseball teams in the 2017 and 2018 seasons. How do the range and third quartile of each data set compare?
Step 1 :
Range:

The range for 2017 is about 50 wins. The range for 2018 is about 70 wins.
Step 2 :
Compare the values for both ranges.
- 50 < 70
The range for 2017 is less than the range for 2018.
Step 3 :
Estimate the third quartile for both data sets.
- The third quartile in a box plot represented by the right edge of the box.
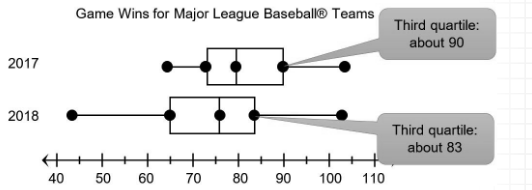
The third quartile for 2017 is about 90. The third quartile for 2018 is about 83.
Step 4 :
Compare the values for both third quartiles.
- 90 > 83
The third quartile for 2017 is greater than the third quartile for 2018.
Problem 3 :
The box plots show data about the ratings of the movies that are in Mateo's movie collection, stored by genre. Compare the range and interquartile range of the two data sets.
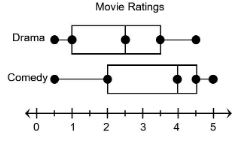
Fill in the blank with greater than, less than, or equal to.
The range for dramas is ______ the range for comedies. The interquartile range for dramas is _______ the interquartile range for comedies.
Solution:
Drama:
Range:
Range = 4.5 - 0.5 = 4
Interquartile range:
Interquartile range = 3.5 - 1 = 2.5
Comedy:
Range:
Range = 5 - 0.5 = 4.5
Interquartile range:
Interquartile range = 4.5 - 2 = 2.5
The range for dramas is less than the range for comedies. The interquartile range for dramas is equal to the interquartile range for comedies.
Problem 4 :
Mr. Maha's class and Ms. Tripp's class collected data about the number of each color of candy in a sample of bags of that candy. The box plots show data about their results.
Calculate the following measures for each class.
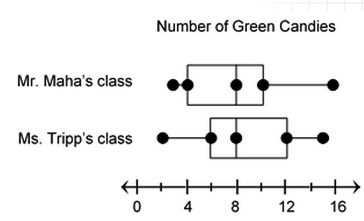
1. Interquartile range 2. Median
3. First Quartile 4. Minimum value
Solution:
1.
Interquartile range = 10 - 4
= 6
The interquartile range for Mr. Maha's class is 6 number of green candies.
Interquartile range = 12 - 6
= 6
The interquartile range for Ms. Tripp's class is 6 number of green candies.
2.
The median number of green candies for Mr. Maha's class is 8.
The median number of green candies for Ms. Tripp's class is 8.
3.
The first Quartile for Mr. Maha's class is about 4.
The first Quartile for Ms. Tripp's class is about 6.
4.
The minimum value for Mr. Maha's class is 3.
The minimum value for Ms. Tripp's class is 2.
Problem 5 :
From the box and whisker plots given below,

Complete the sentences below with less than, greater than, or equal to.
1. The interquartile range for Mr. Maha's class is ______ the interquartile range for Ms. Tripp's class.
2. The median for Mr. Maha's class is ______ the median range for Ms. Tripp's class.
3. The first quartile for Mr. Maha's class is ________ the first quartile for Ms. Tripp's class.
4. The minimum for Mr. Maha's class is _______ the minimum for Ms. Tripp's class.
Solution :
1. The interquartile range for Mr. Maha's class is equal to the interquartile range for Ms. Tripp's class.
2. The median for Mr. Maha's class is equal to the median range for Ms. Tripp's class.
3. The first quartile for Mr. Maha's class is less than the first quartile for Ms. Tripp's class.
4. The minimum for Mr. Maha's class is greater than the minimum for Ms. Tripp's class.
Problem 6 :
A local basketball league has several teams. The box plots show data about the shoe sizes for players on two of those teams. Use these box plots for questions.
Determine if the statement below is true or false. If false, rewrite it to be true.
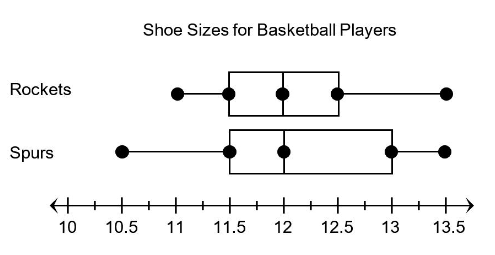
Complete the sentences below with less than, greater than, or equal to.
1) The range of shoe sizes for both teams is equal.
2) The third quartile for the Spurs is greater than the third quartile for the Rockets.
3) The median for the Rockets is less than the median for the Spurs.
Solution :
Range for rockets = maximum value - minimum value
= 13.5 - 11
= 2.5
Range for spurs = maximum value - minimum value
= 13.5 - 10.5
= 3
2.5 ≠ 3
The above statement is false.
2) The third quartile for the Spurs is greater than the third quartile for the Rockets.
Third quartile for Spurs = 13
Third quartile for Rockets = 12.5
13 > 12.5
The above statement is true.
3) The median for the Rockets is less than the median for the Spurs.
Median for Rockets = 12
Median for Spurs = 12
12 = 12
The above statement is false.
Problem 7 :
The box plots show data about the heights, in feet, of two different types of trees at a local nursery.
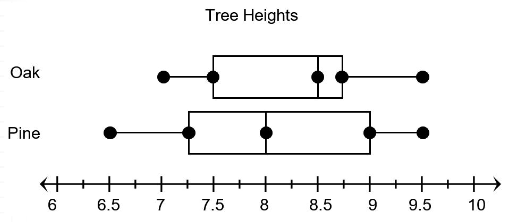
Which statement is best supported by the information in the box plots?
A. The interquartile range of heights of oak trees is less than the interquartile range of heights of pine trees.
B. The range of heights of oak trees is the same as the range of heights for pine trees.
C. The median height of pine trees is greater than the median height of oak trees.
D. The first quartile height of oak trees is less than the first quartile height of pine trees.
Solution:
A.
Interquartile range for oak trees = 8.8 - 7.5 = 1.3
Interquartile range for pine trees = 9 - 7.3 = 1.7
1.3 < 1.7
B.
Range for oak trees = 9.5 - 7 = 2.5
Range for pine trees = 9.5 - 6.5 = 3
2.5 < 3
C.
Median for oak trees = 8.5
Median for pine trees = 8
8.5 > 8
D.
First quartile for oak trees = 7.5
First quartile for pine trees = 7.3
7.5 > 7.3
So, statement A is best supported by the information in the box plots.
Problem 8 :
The box plots show data about the ages of actors and actresses who won the Academy Award for Best Actor or Best Actress through 2018.
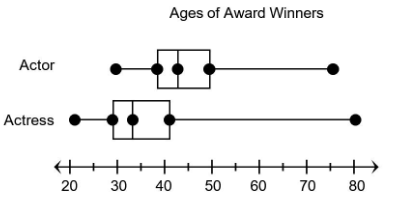
Which statement is best supported by the information in the box plots?
A. The first quartile age of Best Actor winners is less than the first quartile age of Best Actress winners.
B. The minimum age of Best Actor winners is less than the minimum age of Best Actress winners.
C. The median age of Best Actress winners is greater than the median age of Best Actor winners.
D. The range of ages of Best Actress winners is greater than the range of ages of Best Actor winners.
Solution:
A.
First quartile age of best actor winners = 38
First quartile age of best actress winners = 29
38 > 29
B.
Minimum age of best actor winners = 30
Minimum age of best actress winners = 20
30 > 20
C.
Median age of best actor winners = 44
Median age of best actress winners = 34
44 > 34
D.
Range of ages of best actor winners = 75 - 30 = 45
Range of ages of best actress winners = 80 - 20 = 60
45 < 60
So, statement D is best supported by the information in the box plots.
Problem 9 :
The box plots show data about the hat sizes of two different baseball teams.
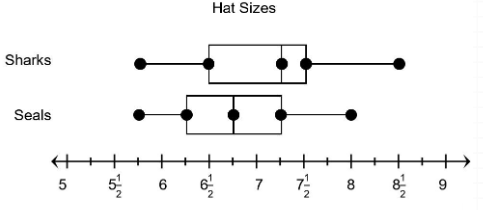
Which statement is best supported by the information in the box plots?
A. The median hat size for the Sharks is less than the median hat size for the Seals.
B. The median hat size for both teams is the same.
C. Th interquartile range of hat sizes for both teams is the same.
D. The interquartile range of hat sizes for the Sharks is greater than the interquartile range of hat sizes for the Seals.
Solution:
Median:
Sharks = 7.3
Seals = 6.8
Sharks > Seals
Interquartile range:
Sharks = 7.5 - 6.3 = 1
Seals = 7.3 - 6.3 = 1
Sharks = Seals
So, statement C is best supported by the information in the box plots.
Subscribe to our ▶️ YouTube channel 🔴 for the latest videos, updates, and tips.
Recent Articles
-
Finding Range of Values Inequality Problems
May 21, 24 08:51 PM
Finding Range of Values Inequality Problems -
Solving Two Step Inequality Word Problems
May 21, 24 08:51 AM
Solving Two Step Inequality Word Problems -
Exponential Function Context and Data Modeling
May 20, 24 10:45 PM
Exponential Function Context and Data Modeling