CALCULATING STANDARD DEVIATION WORKSHEET
Subscribe to our ▶️ YouTube channel 🔴 for the latest videos, updates, and tips.
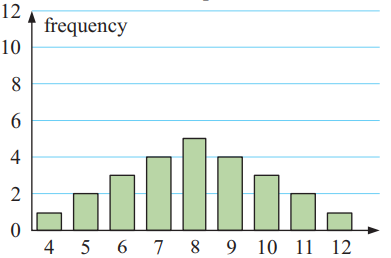
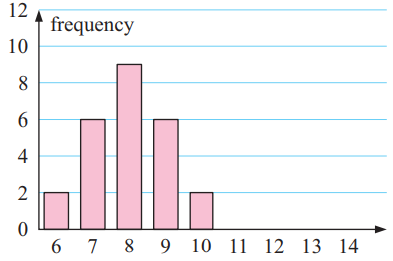
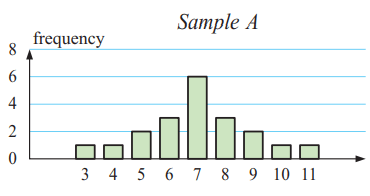
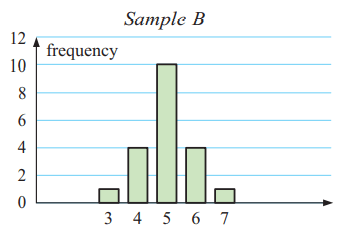
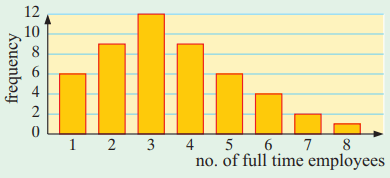
Find the mean and standard deviation from the bar graph given below.
Problem 1 :
Problem 2 :
Problem 3 :
Problem 4 :
Problem 5 :
Answer Key
1) mean = 8 and standard deviation = 2
2) mean = 8 and standard deviation = 1.16
3) mean = 7 and standard deviation = 1.84
4) Mean = 13 and standard deviation = 0.80
5) Mean = 3.5 and standard deviation = 1.72
Problem 1 :
The weekly wages (in dollars) of 90 workers in a steel yard are given alongside :
Find estimates of the mean wage and the standard deviation of the wages.
|
Wage ($) 360 - 369.99 370 - 379.99 380 - 389.99 390 - 399.99 400 - 409.99 410 - 419.99 420 - 429.99 430 - 439.99 |
Number of Workers 5 16 27 16 12 8 4 2 |
Problem 2 :
A random sample of the weekly supermarket bills for a number of families was observed and recorded in the table given.
a. Find the mean bill and the standard deviation of the bills.
b. variance of the population
|
Bill ($) 70 - 79.99 80 - 89.99 90 - 99.99 100 - 109.99 110 - 119.99 120 - 129.99 130 - 139.99 140 - 149.99 |
No. of families 27 32 48 25 37 21 18 7 |
Problem 3 :
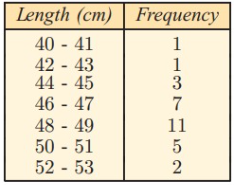
The length of 30 randomly selected 12 day old babies were measured to the nearest cm and the following data obtained.
i) Find the mean length and standard deviation of the lengths.
ii) Find the variance.
Answer Key
1) Mean wages = 392.10 and Standard deviation = 16.34
2) Mean = 103.50, Standard deviation = 19.14
b) Variance = 366.33
3) i) Mean = 47.76, standard deviation = 2.65
ii) Variance = 7.05
Subscribe to our ▶️ YouTube channel 🔴 for the latest videos, updates, and tips.
Recent Articles
-
Finding Range of Values Inequality Problems
May 21, 24 08:51 PM
Finding Range of Values Inequality Problems -
Solving Two Step Inequality Word Problems
May 21, 24 08:51 AM
Solving Two Step Inequality Word Problems -
Exponential Function Context and Data Modeling
May 20, 24 10:45 PM
Exponential Function Context and Data Modeling