CALCULATING STANDARD DEVIATION WHEN FREQUENCY IS GIVEN
Subscribe to our ▶️ YouTube channel 🔴 for the latest videos, updates, and tips.
Problem 1 :
Find the standard deviation of the distribution :
Score
Frequency
1
1
2
2
3
4
4
2
5
1
Solution :
Where s is the standard deviation
x is any score, x̄ is the mean and f is the frequency of each score
x
1
2
3
4
5
Total
f
1
2
4
2
1
10
fx
1
4
12
8
5
30
x - x̄
-2
-1
0
1
2
(x -x̄)2
4
1
0
1
4
f(x -x̄)2
4
2
0
2
4
12
Problem 2 :
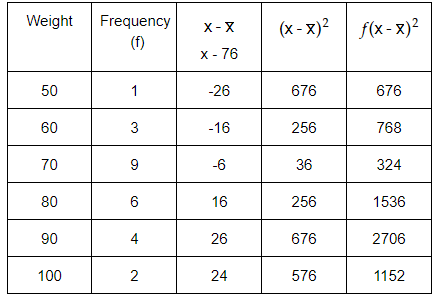
The weights (in kilograms) of 25 calves were measured and the results placed in a table as shown alongside.
a. Find an estimate of the standard deviation by using interval midpoints.
Weight (kg)
50
60
70
80
90
100
Frequency
1
3
9
6
4
2
Solution :

Problem 3 :
Find the standard deviation of the following test results.
Test score, x
Frequency, f
10
4
11
6
12
7
13
2
14
3
15
2
Solution :
x
10
11
12
13
14
15
Total
f
4
6
7
2
3
2
24
fx
40
66
84
26
42
30
288
x - x̄
-2
-1
0
1
2
3
(x - x̄)2
4
1
0
1
4
9
f(x -x̄)2
16
6
0
2
12
18
54
Problem 4 :
The number of chocolates in 60 boxes was counted and the results tabulated.
|
Number of chocolates 25 26 27 28 29 30 31 32 |
Frequency 1 5 7 13 12 12 8 2 |
Find the mean and standard deviation of the distribution.
Solution :
x
25
26
27
28
29
30
31
32
f
1
5
7
13
12
12
8
2
60
fx
25
130
189
364
348
360
248
64
1728
x - x̄
-3.8
-2.8
-1.8
-0.8
0.2
1.2
2.2
3.2
(x - x̄)2
14.44
7.84
3.24
0.64
0.04
1.44
4.84
10.24
f(x - x̄)2
14.44
39.2
22.68
8.32
0.48
17.28
38.72
20.48
167.58
Problem 5 :
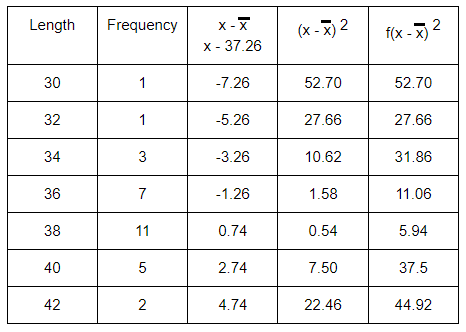
The lengths of 30 trout were measured to the nearest cm and the following data obtained :
Find estimates of the mean length and the standard deviation of the lengths.
|
Length (cm) 30 32 34 36 38 40 42 |
Frequency 1 1 3 7 11 5 2 |
Solution :

Subscribe to our ▶️ YouTube channel 🔴 for the latest videos, updates, and tips.
Recent Articles
-
Finding Range of Values Inequality Problems
May 21, 24 08:51 PM
Finding Range of Values Inequality Problems -
Solving Two Step Inequality Word Problems
May 21, 24 08:51 AM
Solving Two Step Inequality Word Problems -
Exponential Function Context and Data Modeling
May 20, 24 10:45 PM
Exponential Function Context and Data Modeling