ALGEBRA PRACTICE QUESTIONS
Problem 1 :
The graph of quadratic function r is shown on the grid.
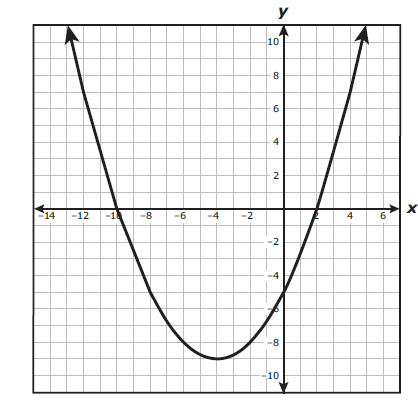
Which answer choice best represents the intercepts of the graph of r ?
|
A) x – intercept : (5, 0) y – intercepts : (0, 10) and (0, -2) C) x – intercept : (0, 5) y – intercepts : (10, 0) and (-2, 0) |
B) x – intercepts : (0, -10) and (0 ,2) y – intercept : (-5, 0) D) x – intercepts : (-10, 0) and (2, 0) y – intercept : (0, -5) |
Problem 2 :
A worker is packing items in boxes. The table shows the linear relationship between the number of items the worker has packet in boxes after different amounts of time.
Items Packed in Boxes
|
Number of Minutes 5 7 11 14 |
Number of Items Packed 20 28 44 56 |
Which statement describes the rate of change of the number of items the worker packed in boxes with respect to the number of minutes the worker has been packing items in boxes ?
F) The worker packed 8 items in boxes per minute.
G) The worker packed 37 items in boxes per minute.
H) The worker packed 4 items in boxes per minute.
J) The worker packed 15 items in boxes per minute.
Problem 3 :
A system of equations is graphed on the grid.
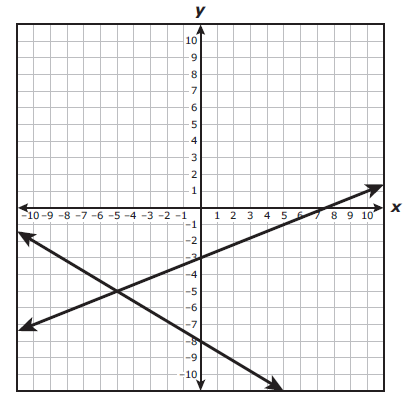
Which system of equations is best represented by the graph ?
Problem 4 :
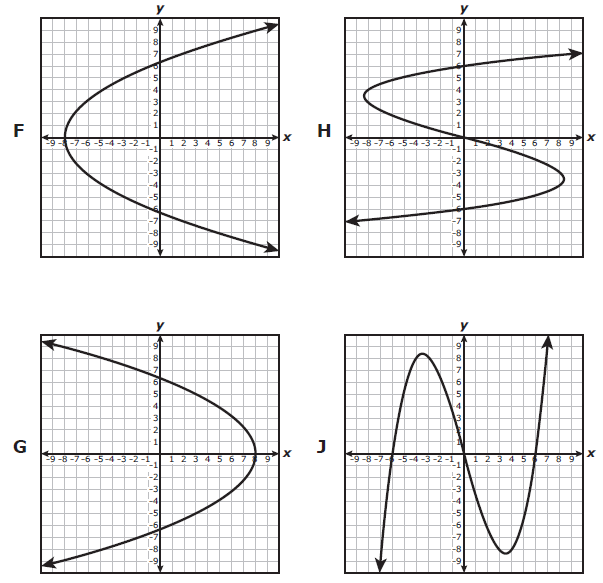
Which graph represents y as a function of x ?
Problem 5 :
What is the solution to this system of equations ?
2x + y = 40
x – 2y = -20
A) (12, 16) B)(15, 17.5) C) There is no solution.
D) There are an infinite number of solutions.
Problem 6 :
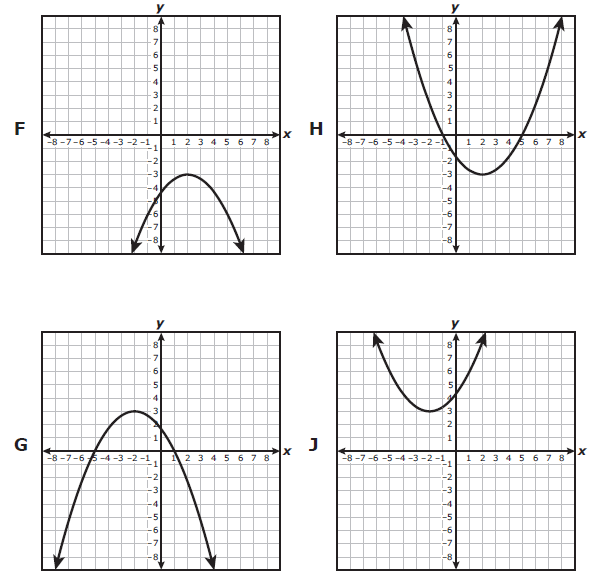
Which graph best represents a quadratic function with a range of all real numbers greater than or equal to 3 ?
Problem 7 :
The value of y is directly proportional to the value of x. When x = 512, y = 128.
What is the value of y when x = 64 ?
A) 256 B) 32 C) 16 D) 8
Problem 8 :
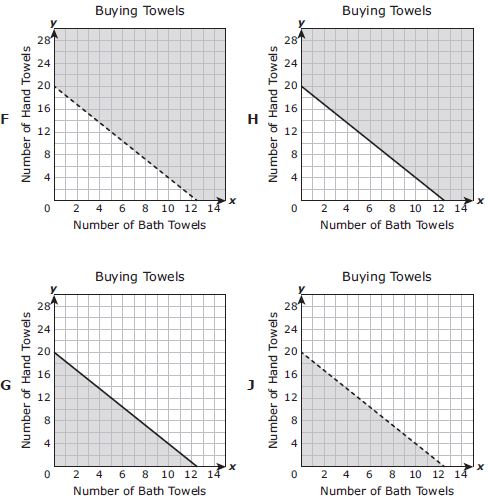
A customer is buying bath towels and hand towels and can spend no more than $100. Each bath towel costs $8, and each hand towel costs $5. The inequality 8x + 5y ≤ 100 represents all possible combinations of x, the number of bath towels, and y, the number of hand towels the customer can buy.
Which graph best represents the solution set for this inequality ?
Problem 9 :
An exponential function is graphed on the grid.
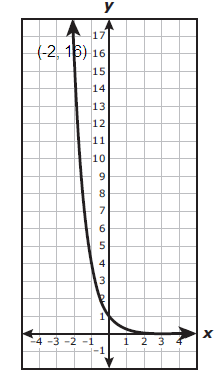
Which function is best represented by the graph ?
A) p(x) = (0.25)x B) p(x) = 2(0.5)x
C) p(x) = (1.25)x D) p(x) = (25)x
Problem 10 :
Which expression is equivalent to (n - 4) (2n + 7) ?
F) 3n + 3 G) n - 28 H) 2n2 -15n - 28 J) 2n2 - n - 28
Problem 11 :
Which situation shows causation ?
A) When the number of people in a bus increases, the number of animals in a zoo also increases.
B) When the number of hours worked each week by an hourly employee decreases, the amount of money earned by the employee also decreases.
C) When the amount of a discount for a sale increases, the number of items sold during the sale decreases.
D) When the number of bike trails in a city decreases, the amount of rainfall in the city increases.
Problem 12 :
A system of linear equations is represented by line h and line j, A table representing some points on line h and the graph of line j are shown.
Line h
|
x |
-16 |
-8 |
-4 |
12 |
|
y |
7 |
1 |
-2 |
-14 |
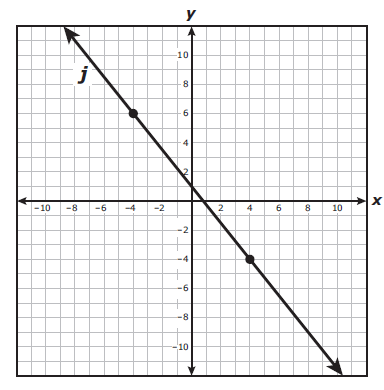
Which system of equations is best represented by lines h and j ?
Recent Articles
-
Finding Range of Values Inequality Problems
May 21, 24 08:51 PM
Finding Range of Values Inequality Problems -
Solving Two Step Inequality Word Problems
May 21, 24 08:51 AM
Solving Two Step Inequality Word Problems -
Exponential Function Context and Data Modeling
May 20, 24 10:45 PM
Exponential Function Context and Data Modeling