STAAR TEST ON DATA ANALYSIS QUESTIONS ON GRADE 4
Subscribe to our ▶️ YouTube channel 🔴 for the latest videos, updates, and tips.
Problem 1 :
Dawn kept a record of the number of minutes she walked on 16 different days. Her data is shown below.
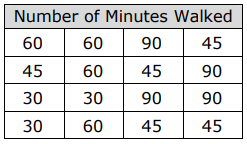
Dawn decided to create a frequency table using her data. What number will Dawn use on a frequency table to represent the number of times she walked 60 minutes?
A) 3 B) 5 C) 2 D) 4
Problem 2 :
Sean is training to run at a cross country track meet. He recorded the number of miles he ran on different days.
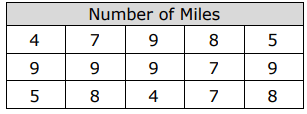
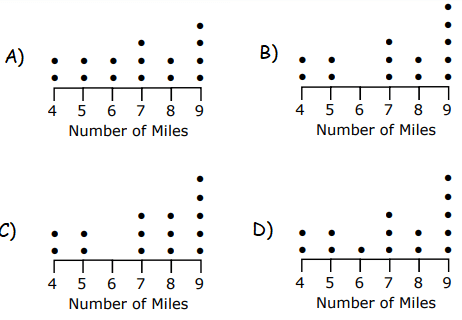
Which dot plot represents the data Sean recorded?
Problem 3 :
Keri recorded the number of points for each of the words she created during a word game


Which stem-and-leaf plot represents the points Keri scored?
Problem 4 :
Students in Juanita's class kept a record of the number of different types of birds each of them saw during recess. The data is shown below.

Juanita wants to make a dot plot to represent the data. How many dots will she place above the number 5?
A) 3 B) 1 C) 2 D) 5
Problem 5 :
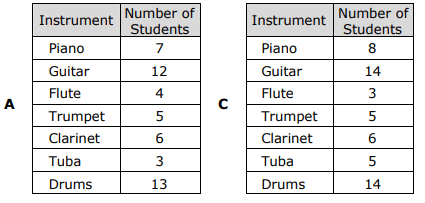
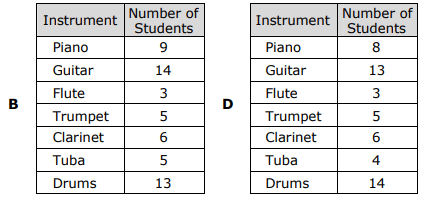
A fourth grade class attended a band concert. After the concert, the band conductor asked each student to name their favorite instrument. He recorded the data using tally marks.
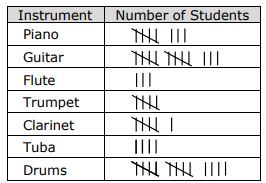
Which frequency table represents the number of students that chose each instrument?
Problem 6 :
The data shown below represents the heights of students in Juan's class.
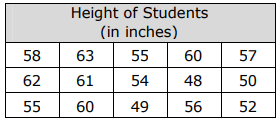
Juan has decided to create a stem-and-leaf plot to represent the heights. How many leaves will he put in the stem-and-leaf plot?
A) 10 B) 3 C) 12 D) 15
Problem 7 :
Jeri walks her puppy each day. She recorded the distance they walked in the table below.
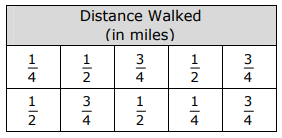
Jeri has decided to create a frequency table to represent the data. What number should she use to represent the number of times they walked 3 4 mile?
A) 2 B) 5 C) 3 D) 4
Problem 8 :
Keith surveyed the students in his class to find the number of siblings each of them has. The data is shown below.
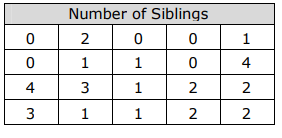
Keith wants to make a dot plot to represent the data. What data points will be labeled below the number line in the dot plot?
A) 1, 2, 3 B) 1, 2, 3, 4 C) 0, 1, 2 D) 0, 1, 2, 3, 4
Problem 9 :
The data shown below represents the number of jumping jacks completed by 15 students in one minute. The physical education teacher is making a stem-and-leaf plot to display the data.
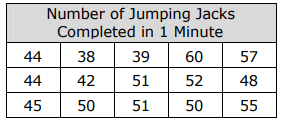
What stems will the teacher put in the stem-and-leaf plot?
A) 0, 3, 4, 5, 9 B) 3, 4, 6 C) 0, 1, 2, 3, 5, 8, 9 D) 3, 4, 5, 6
Problem 10 :
The chart below represents the fraction of a whole watermelon ten different cousins ate
at a family reunion.
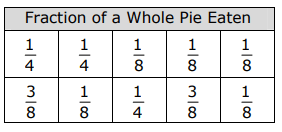
Sean has decided to make a frequency table to represent the data. What number will he put in the frequency column for 1/4 ?
A) 5 B) 2 C) 7 D) 3
Subscribe to our ▶️ YouTube channel 🔴 for the latest videos, updates, and tips.
Recent Articles
-
Finding Range of Values Inequality Problems
May 21, 24 08:51 PM
Finding Range of Values Inequality Problems -
Solving Two Step Inequality Word Problems
May 21, 24 08:51 AM
Solving Two Step Inequality Word Problems -
Exponential Function Context and Data Modeling
May 20, 24 10:45 PM
Exponential Function Context and Data Modeling